Paper 3 Measurement Answers
Question 1: Measurement model, transformation and graph analysis [15]
(a) The model predicts is directly proportional to [1]. It therefore predicts a straight line through the origin on a graph of against [1].
(b)
| 0.250 | 0.350 | 0.450 | 0.550 | 0.650 | |
|---|---|---|---|---|---|
| 1.00 | 1.42 | 1.80 | 2.19 | 2.59 |
Correct squaring method [1]; values [1]; sensible significant figures [1].
(c) Award independently:
- axes labelled with quantity and unit, with on the vertical axis [1];
- simple scales using at least half the available grid in both directions [1];
- all five points plotted accurately as small crosses [1];
- one straight best-fit line representing the overall trend, not a dot-to-dot join [1].
An indicative completed graph is shown below. Small differences in best-fit placement are acceptable.
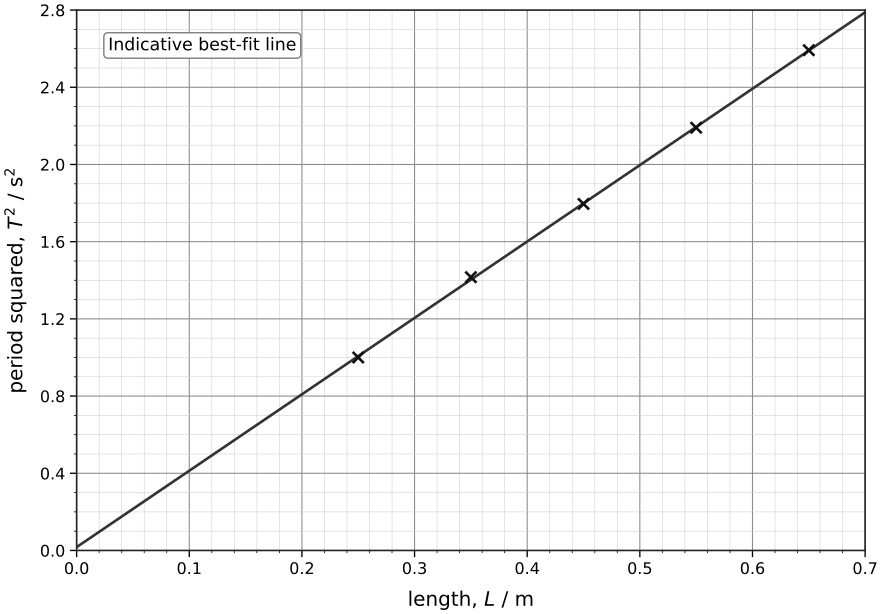
(d) Use two well-separated points on the candidate’s best-fit line, not necessarily two measured points. For example, an acceptable line gives
Large-triangle gradient method [1]; value consistent with the drawn line, typically to [1]; unit [1]. Apply follow-through from the candidate’s line.
(e) The total timed interval is larger [1], so a similar reaction-time uncertainty is a smaller percentage of the measured interval and hence of each period [1].
(f) Accept one relevant feature [1], for example a zero offset in the measured length, measuring length from the wrong reference point, or a timing-system delay that does not cancel between starting and stopping. Do not award merely “reaction time” without explaining a consistent offset; similar start and stop delays may cancel in an elapsed-time measurement.
Question 2: Longer structured vector investigation [20]
(a)
Correct trigonometric components [2]; units/signs [1].
(b)
East component [1]; north component [1].
(c)
north of east. Magnitude method/value [2]; direction method/value [2].
(d) The two displacements are not along the same line [1], so direction matters and only components or a vector diagram can combine them correctly [1].
(e)
Fractional or percentage method [1]; value [1].
(f) Changing the angle rotates the vector [1]. Since and [1], both component values depend on even if is fixed [1].
(g) Use a stated scale [1], draw the first vector east and the second vector head-to-tail at north of east [1], then measure the resultant from the starting point to final point with magnitude and direction [1].
(h) Scale drawings are limited by drawing thickness, protractor/ruler resolution, and human reading uncertainty [1].
Review Figures
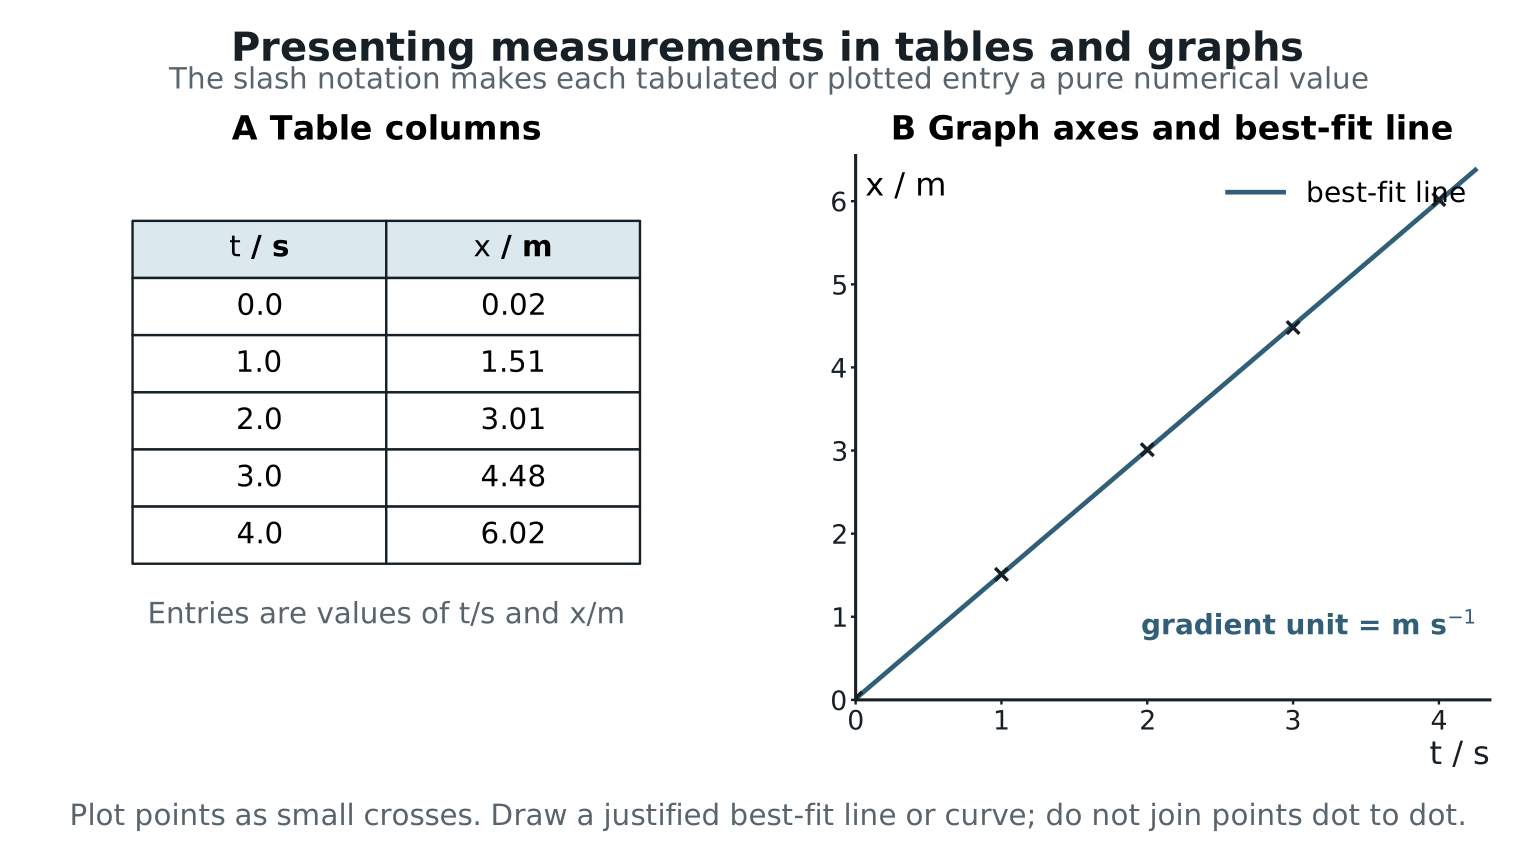
Figure: Paper 3 graph reasoning normally expects correctly transformed quantities, clear axes, sensible units and physical interpretation of gradient or intercept. In Question 1, plotting against makes the proportional model testable.
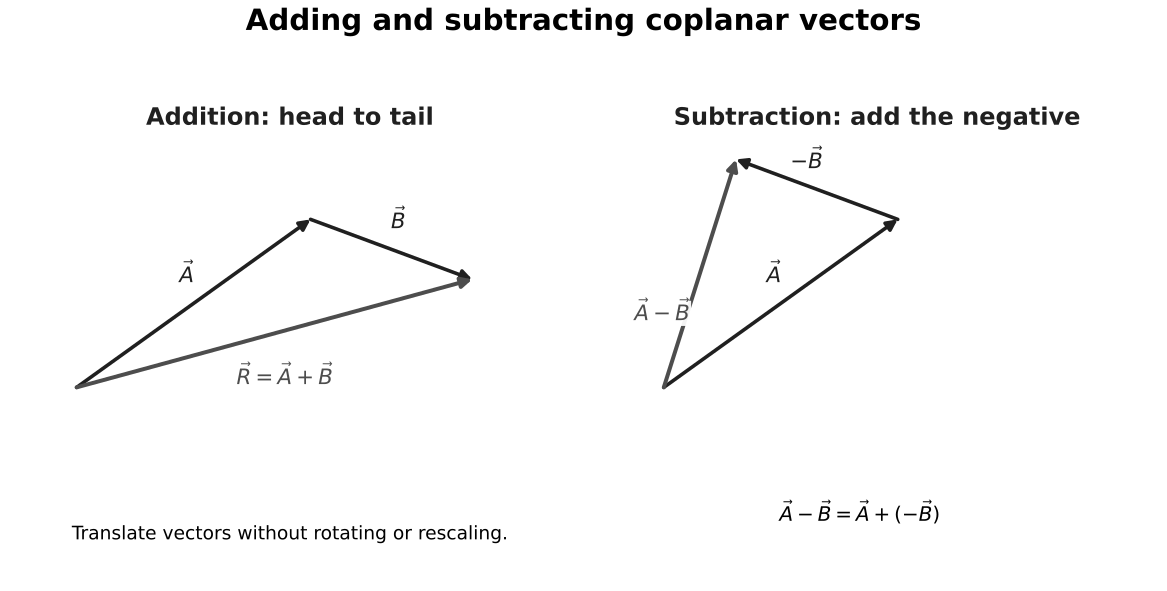
Figure: The vector workflow in Question 2 is the component version of head-to-tail addition: resolve each displacement, add signed components, then reconstruct the resultant magnitude and direction.