Paper 4 Measurement Practical-Style Answers
Question 1: Spring data, graph and gradient [22]
(a) Independent variable: mass [1]. Dependent variable: extension [1].
(b) The table headings state quantities [1] and units using the form quantity/unit, so units are not repeated in every cell [1].
(c) Award independently:
- axes labelled and , with vertical [1];
- simple scales using at least half the grid in each direction [1];
- all six points plotted accurately as small crosses [2];
- one straight line of best fit representing the overall trend [1].
An indicative completed graph is shown below. Accept reasonable differences in best-fit placement.
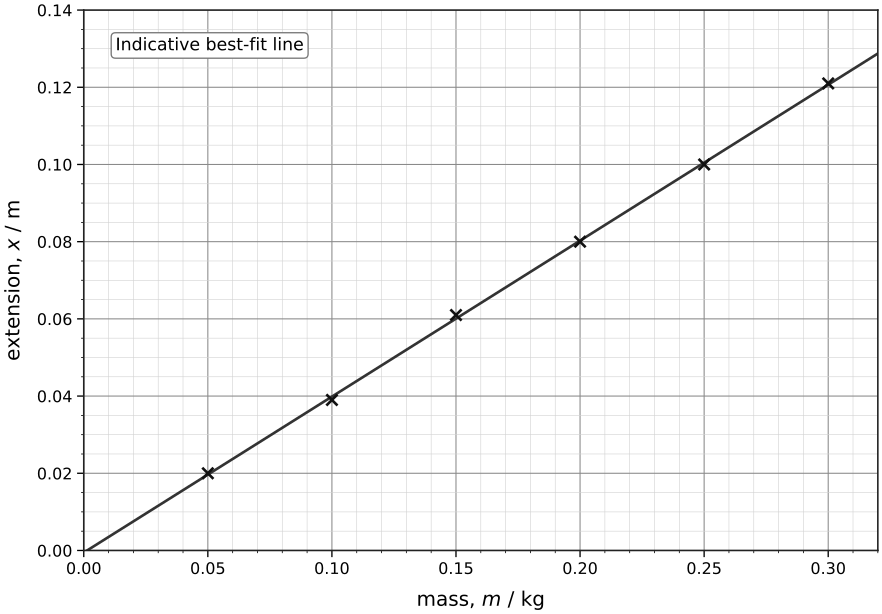
(d) Use two well-separated points on the candidate’s best-fit line. An acceptable result is
Large triangle using points on the line [1]; value consistent with the candidate’s line, typically to [1]; unit [1].
(e) Since the gradient is ,
Correct rearrangement and follow-through [1]; value with unit [1].
(f) It could indicate a zero error in the extension measurement, such as using an incorrect unloaded reference length [1], or that the spring/model does not behave proportionally over the chosen range [1].
(g) Random uncertainty: for example, the load may still oscillate or the ruler reading may vary because alignment/parallax varies; this causes scatter in [2]. Systematic error: for example, all extensions may be found from an incorrectly recorded unloaded reference position, shifting every value in one direction [2]. Accept other experiment-specific sources with a correct mechanism. Do not award unrelated generic errors such as reaction time.
(h) Any one well-explained improvement: take more data over a wider range of ; repeat readings and average; use an instrument with suitable finer resolution; ensure consistent alignment. Improvement [1]; link to gradient uncertainty [1].
Question 2: Planning a diameter and density measurement [20]
(a) Measure mass [1], length [1], and diameter or radius [1].
(b)
Correct density relation [1]; cylindrical volume [1]; expression in measured quantities [1].
(c) Measure the diameter at several positions along the wire [1] and in different orientations if the cross-section may not be perfectly circular [1]. Record all readings to micrometer precision [1] and calculate a mean diameter [1].
(d) The wire diameter is small [1], so the micrometer’s finer resolution gives a smaller percentage uncertainty than a metre rule [1].
(e) A zero error gives a systematic bias in every diameter reading [1]. Since volume depends on , this biases the calculated density in the opposite direction to the volume error [1].
(f) Use columns with quantity and unit in headings [1], record repeated diameter readings consistently to the same decimal place [1], and include calculated mean diameter and measured mass/length clearly without units repeated in cells [1].
(g) Accept a genuine safety precaution, such as covering or bending back sharp wire ends, wearing eye protection while cutting, or directing cut ends away from people [1]. “Do not overtighten the micrometer” is a handling/accuracy precaution, not by itself a safety precaution.
(h) Any two: check units converted to SI if using ; compare with order of magnitude for metals; check that a larger measured diameter would increase volume and reduce density; check significant figures/uncertainty; verify was not used as [2].
Review Figures
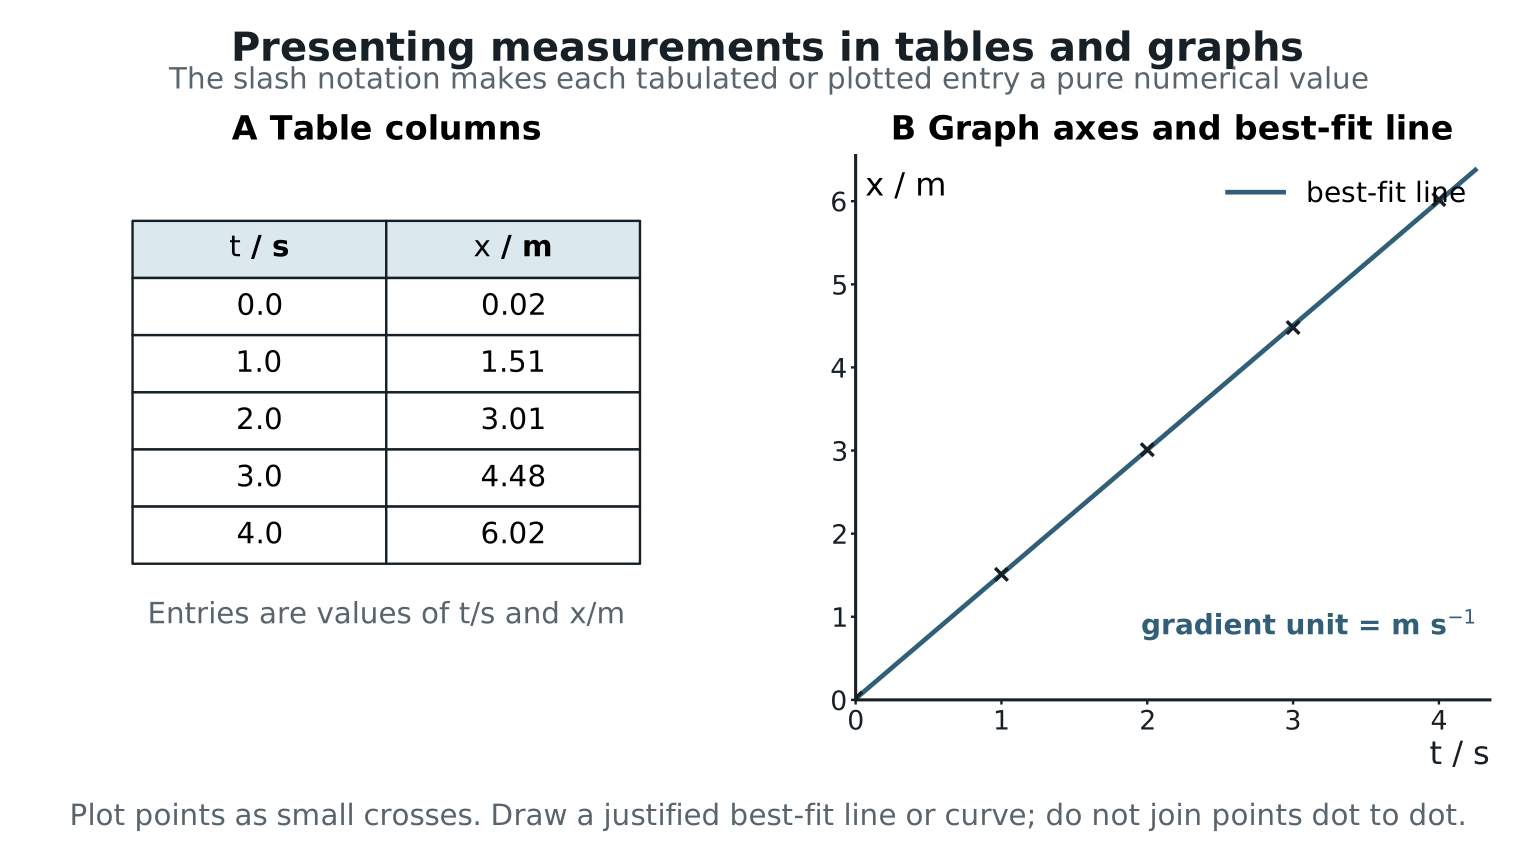
Figure: Practical graph marks usually separate table headings, axis labels, sensible scales, plotted points, best-fit line and gradient interpretation. Question 1 uses the same skills with a new original dataset.
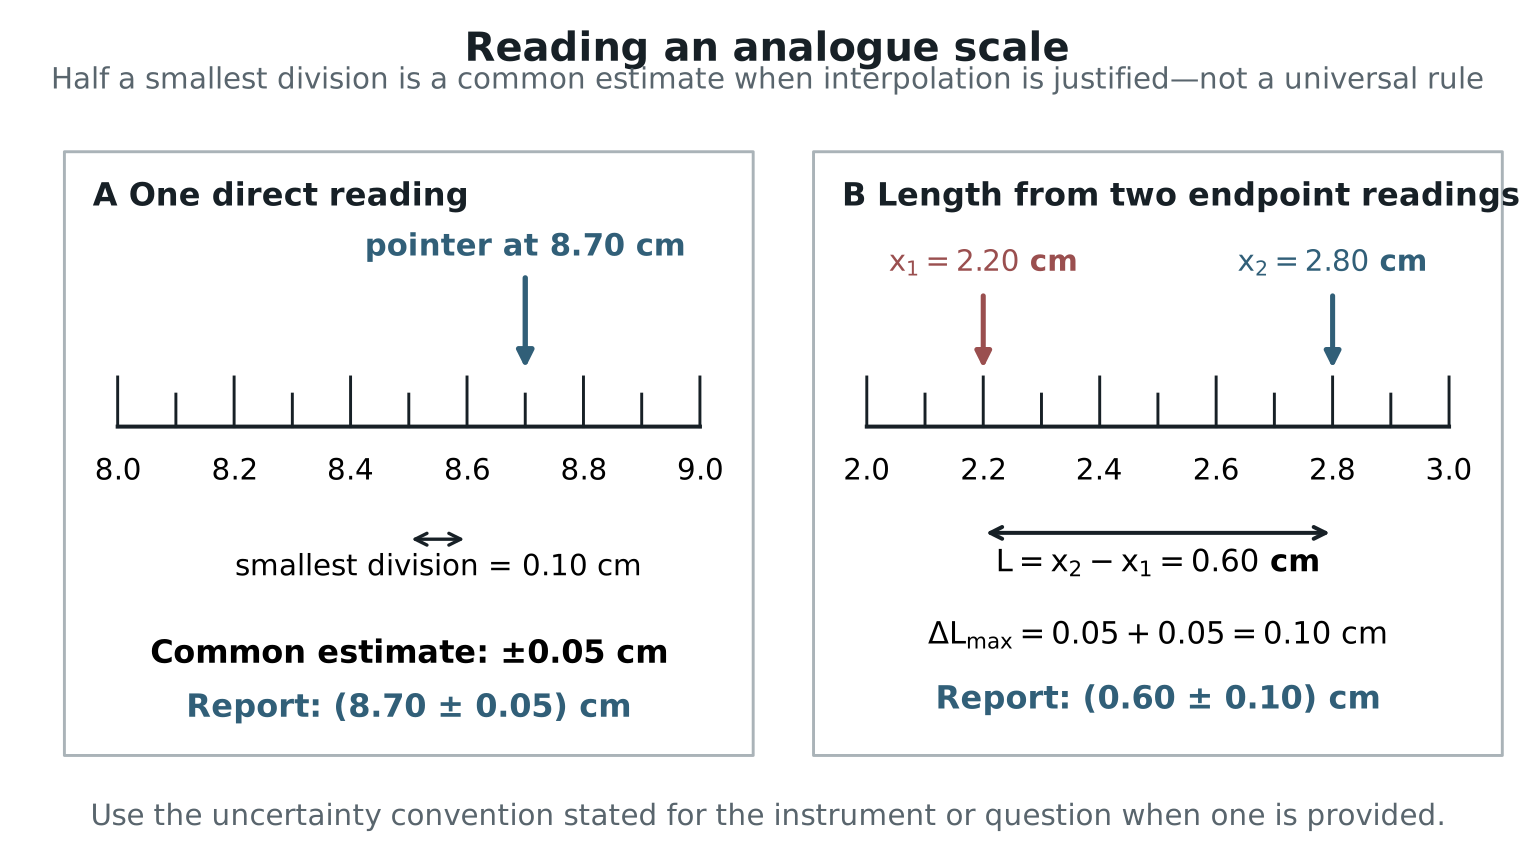
Figure: Instrument resolution sets a default reading uncertainty only when no better uncertainty is stated. For Question 2, the same principle explains why a micrometer is more suitable than a metre rule for measuring a thin wire diameter.