Paper 4 Kinematics Drills
Q1 Timing a trolley on a runway
A student investigates the motion of a trolley released from rest down a straight runway. An electronic release starts a timer at the instant the trolley is released. A light gate placed a distance from the release position stops the timer. The elapsed time is .
The student varies and records .
| 0.120 | 0.200 | 0.300 | 0.420 | 0.560 | 0.720 | |
|---|---|---|---|---|---|---|
| 0.490 | 0.632 | 0.775 | 0.916 | 1.058 | 1.198 |
For motion from rest with constant acceleration,
- Explain why a graph of against should be a straight line through the origin. [2]
- Process the data by calculating suitable values of . [3]
- Plot against on the grid below and draw a straight line of best fit. [5]
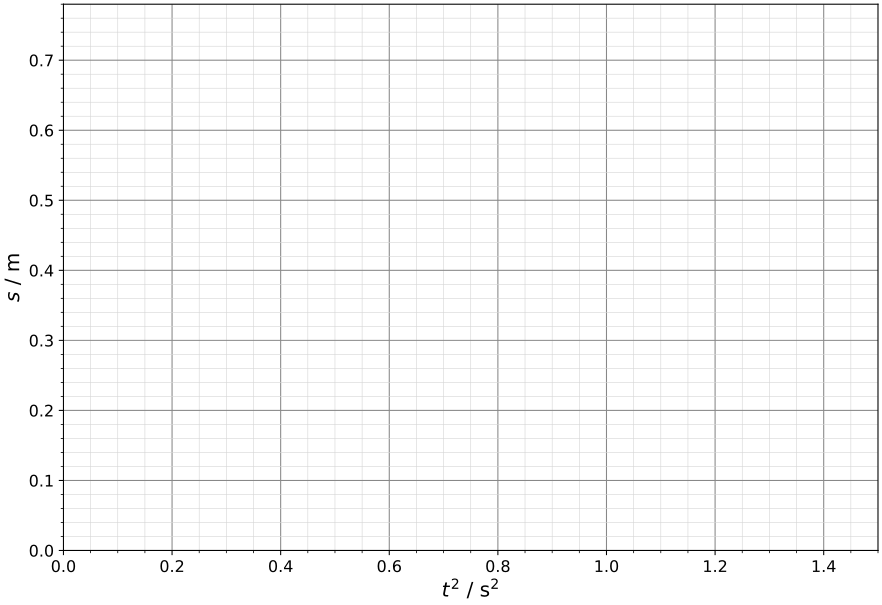
- Use your graph to determine the acceleration . [3]
- State two practical precautions for improving the reliability of the timing measurements. [2]
- Suggest one reason why the plotted points may not pass exactly through the origin. [2]
Q2 Estimating acceleration from video data
A ball rolls along a straight track. A video analysis program gives the following velocities.
| 0.0 | 0.4 | 0.8 | 1.2 | 1.6 | 2.0 | |
|---|---|---|---|---|---|---|
| 0.20 | 0.47 | 0.73 | 1.02 | 1.27 | 1.55 |
- Plot against on the grid below and draw a straight line of best fit. [5]
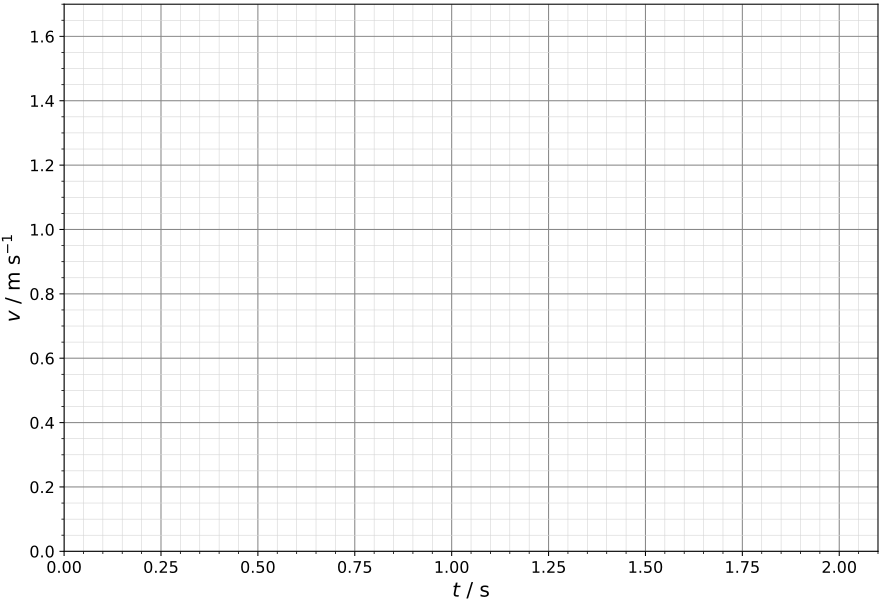
- Use your graph to determine the acceleration. [3]
- Explain why a best-fit line using all the data is preferable to calculating a gradient from only the first and last readings. [2]
- The uncertainty in each velocity value is about . Estimate the percentage uncertainty in the change in velocity between and . [3]
- State one advantage of video analysis over a handheld stopwatch for this experiment. [1]