Kinematics Graphs and Calculus
Overview
Graphs are one of the most important tools in H2 Physics kinematics. They allow students to:
- describe motion visually
- determine instantaneous quantities
- calculate displacement or change in velocity
- translate between words, graphs, and equations
This page focuses on:
- displacement-time graphs
- velocity-time graphs
- acceleration-time graphs
- gradient meaning
- area meaning
- qualitative graph interpretation
Main topic: Kinematics
Why It Matters
Graph interpretation is where many kinematics marks are won or lost, especially when questions test motion qualitatively.
Definition
Kinematics graphs show how displacement, velocity, and acceleration vary with time, while calculus explains why gradients and areas carry physical meaning.
Core Calculus Relationships
Key Representations
For one-dimensional motion:
Hence:
- velocity is the rate of change of displacement
- acceleration is the rate of change of velocity
Reverse relationships:
At H2 level, these mainly explain gradient and area ideas.
1. Displacement-Time Graphs
Meaning
Shows how displacement changes with time.
Vertical axis: displacement
Horizontal axis: time
Gradient Gives Velocity
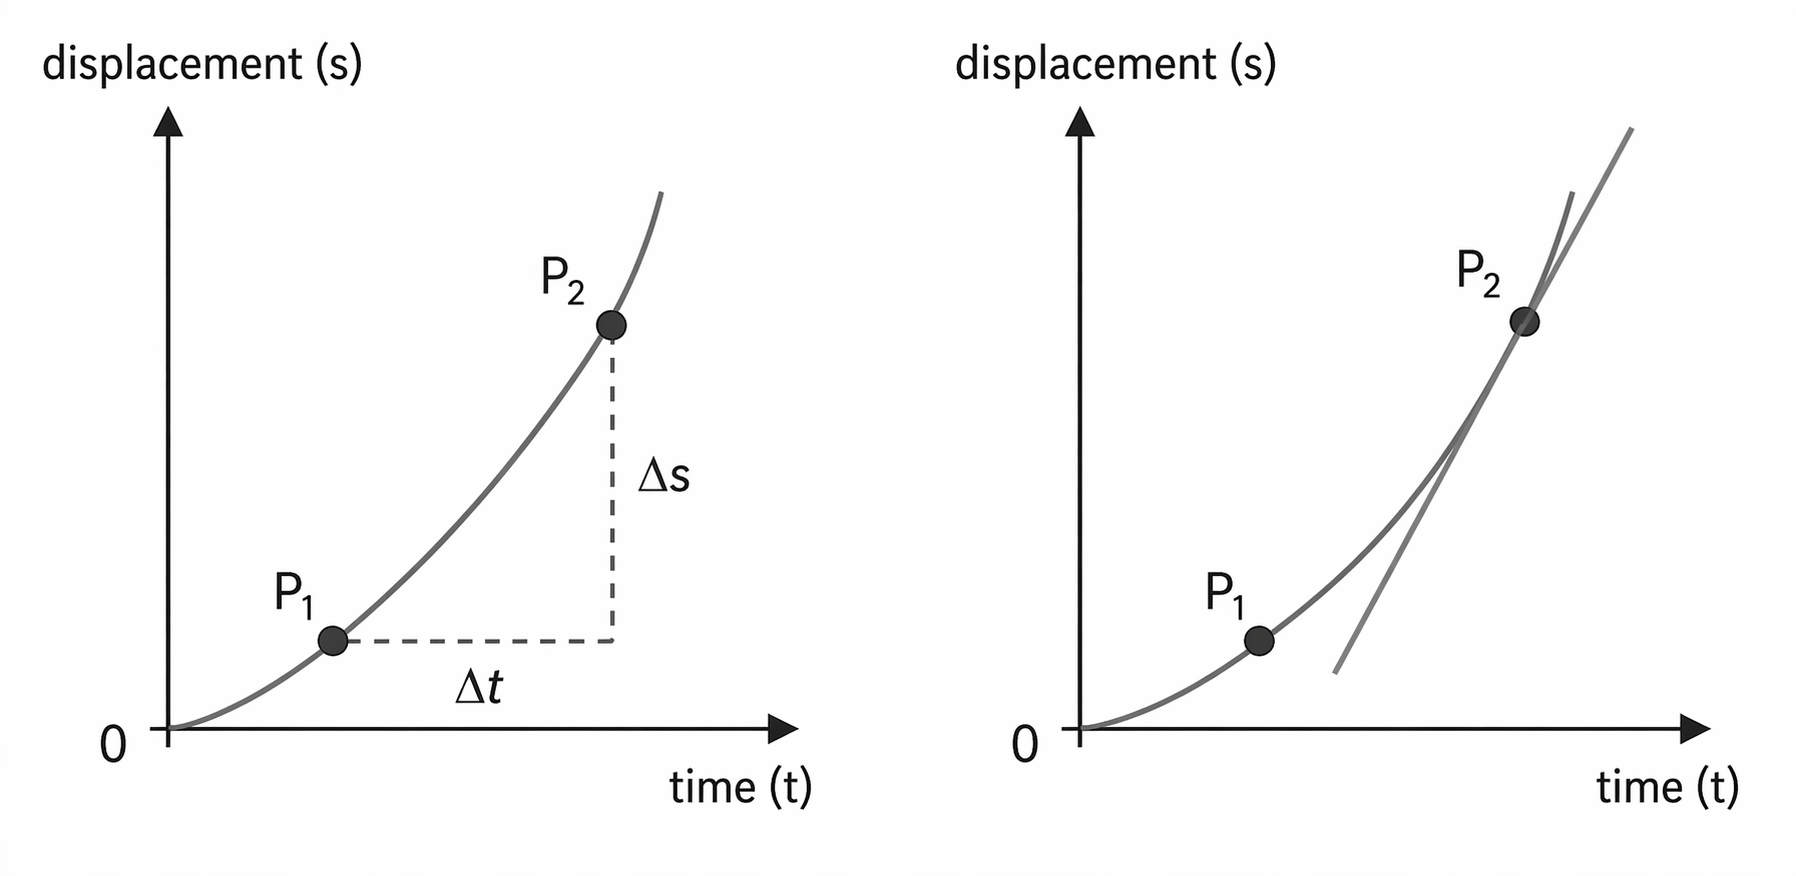
Figure: On a displacement-time graph, average velocity over an interval comes from the secant gradient, while instantaneous velocity at a point comes from the tangent gradient.
Interpretation
- positive gradient → moving in positive direction
- negative gradient → moving in negative direction
- zero gradient → stationary
- steeper gradient → greater speed
Straight vs Curved Graphs
Straight Line
Constant gradient → constant velocity
Curve
Changing gradient → changing velocity
Instantaneous Velocity
For a curved graph, draw a tangent at the point.
Its gradient gives instantaneous velocity.
Example
If the graph rises, becomes flat, then falls:
- object moves forward
- stops momentarily
- moves back
2. Velocity-Time Graphs
Meaning
Shows how velocity changes with time.
Vertical axis: velocity
Horizontal axis: time
Gradient Gives Acceleration
Interpretation
- positive gradient → positive acceleration
- negative gradient → negative acceleration
- zero gradient → constant velocity
Area Gives Displacement
Signed area matters:
- above axis = positive displacement
- below axis = negative displacement
Distance vs Displacement
If velocity changes sign:
- displacement = signed total area
- distance = sum of magnitudes of areas
Example
Triangle above axis area = 12 m
Triangle below axis area = 5 m
Then:
- displacement = m
- distance = m
3. Acceleration-Time Graphs
Meaning
Shows how acceleration changes with time.
Vertical axis: acceleration
Horizontal axis: time
Area Gives Change in Velocity
If acceleration is constant:
- horizontal line above axis → steady increase in velocity
- horizontal line below axis → steady decrease in velocity
Example
Acceleration for 4 s:
4. Qualitative Graph Reading
From Displacement-Time to Motion
| Graph Feature | Meaning |
|---|---|
| Rising line | positive velocity |
| Falling line | negative velocity |
| Flat line | stationary |
| Increasing steepness | speeding up positive direction |
From Velocity-Time to Motion
| Graph Feature | Meaning |
|---|---|
| Horizontal above axis | constant positive velocity |
| Horizontal below axis | constant negative velocity |
| Crossing axis | changes direction |
| Positive slope | positive acceleration |
From Acceleration-Time to Motion
Need initial velocity to know exact motion.
Example:
- positive acceleration does not guarantee positive velocity
- object may still move in negative direction while slowing down
5. Graph-to-Motion Translation
Example A
Velocity-time graph is horizontal at .
Interpretation:
- moving in positive direction
- constant speed
- acceleration = 0
Example B
Velocity-time graph slopes downward from +10 to 0.
Interpretation:
- moving forward
- slowing down uniformly
- constant negative acceleration
Example C
Displacement-time graph has turning point.
Interpretation:
- gradient = 0 there
- instantaneous velocity = 0
6. Units Check (Useful in Exams)
Gradient Units
s-t graph
→ velocity
v-t graph
→ acceleration
Area Units
v-t graph
→ displacement
a-t graph
→ change in velocity
7. Worked Examples
Example 1
A velocity-time graph rises linearly from 0 to 20 m s in 5 s.
Acceleration
Displacement
Area of triangle:
Example 2
A displacement-time graph is horizontal from 3 s to 7 s.
Gradient = 0.
Therefore object is stationary during that interval.
8. Common Exam Pitfalls
- using graph height instead of gradient
- forgetting area below axis is negative displacement
- assuming curved graph means constant acceleration
- confusing displacement with distance
- forgetting tangent needed for instantaneous gradient
- assuming zero velocity means zero acceleration
9. Quick Summary
- Gradient of s-t graph = velocity
- Gradient of v-t graph = acceleration
- Area under v-t graph = displacement
- Area under a-t graph = change in velocity