Measurement Data Presentation
Branch note: This page deepens one part of Measurement.
Overview
Good measurements can lose marks if presented poorly. In Physics, data must be organised clearly so that trends can be identified and conclusions can be justified.
This page focuses on how to present measurements in tables and graphs, and how to handle significant figures, decimal places, gradients, and intercepts in an exam-oriented way.
See also:
Core Ideas
- Tables should show quantities and units clearly.
- Graph axes should use sensible scales, labelled quantities, and units.
- Gradients and intercepts should be interpreted using their physical units and meaning.
Why It Matters
Clear presentation makes experimental trends easier to see and prevents loss of marks from careless formatting, poor scales, or unjustified precision.
Definition
Measurement data presentation is the clear recording and display of measured or calculated quantities using sensible precision, units, tables, and graphs.
Key Representations
1. Why Data Presentation Matters
Clear presentation helps you:
- reduce careless mistakes
- compare readings easily
- spot patterns
- calculate gradients accurately
- communicate results scientifically
- score practical examination marks
2. Tables
General Rules
Use a table when recording repeated or multiple readings.
A good table should have:
- clear headings
- units in headings, not repeated in every row
- consistent decimal places
- logical order of readings
- sufficient space
- the independent variable in the first (left-hand) column where practical
- raw readings recorded to a precision consistent with the instrument
- calculated values quoted to a justified number of significant figures
Correct Heading Format
Use:
quantity / unitExamples:
The slash means “divided by”. Thus means , and the entries beneath the heading are pure numbers. Do not write the unit again in every cell.
Example Table
| 0.0 | 0.00 |
| 1.0 | 2.10 |
| 2.0 | 4.20 |
Do not repeat units inside each table cell.
3. Significant Figures
Significant figures communicate the justified reported resolution of a value. The digit count alone does not prove that measurements are repeatable (precise), close to a reference value (accurate), or reliable.
Important Rules
-
Leading zeros are not significant
(e.g. 0.0042 → 2 s.f.) -
Zeros between non-zero digits are significant
(e.g. 305 → 3 s.f.) -
Trailing zeros after a decimal point are significant
(e.g. 12.0 → 3 s.f.) -
Trailing zeros in integers may be ambiguous
(e.g. 3050 could be 3 or 4 s.f.; use scientific notation to clarify) -
Calculator outputs should not be copied blindly — round appropriately
Examples
0.00420→ 3 significant figures12.0→ 3 significant figures305→ 3 significant figures3050→ ambiguous → write as (3 s.f.)
Practical Rule
Final answers should not imply more precision than the measurements justify.
4. Decimal Places
Decimal places are especially important when:
- recording repeated measurements in a table
- quoting values with absolute uncertainty
Measured values in one table column should usually be written to a consistent number of decimal places where appropriate.
If a result is written as:
then should usually be quoted to the same decimal place as .
5. Standard Form
Standard form is useful for very large or very small quantities:
where:
Examples:
This makes powers of ten and significant figures clearer.
6. Graph Axes and Units
Every graph should have:
- clearly labelled axes
- quantity and unit on each axis
- sensible scale
Axis Label Format
Use:
Examples:
7. Good Graph Practice
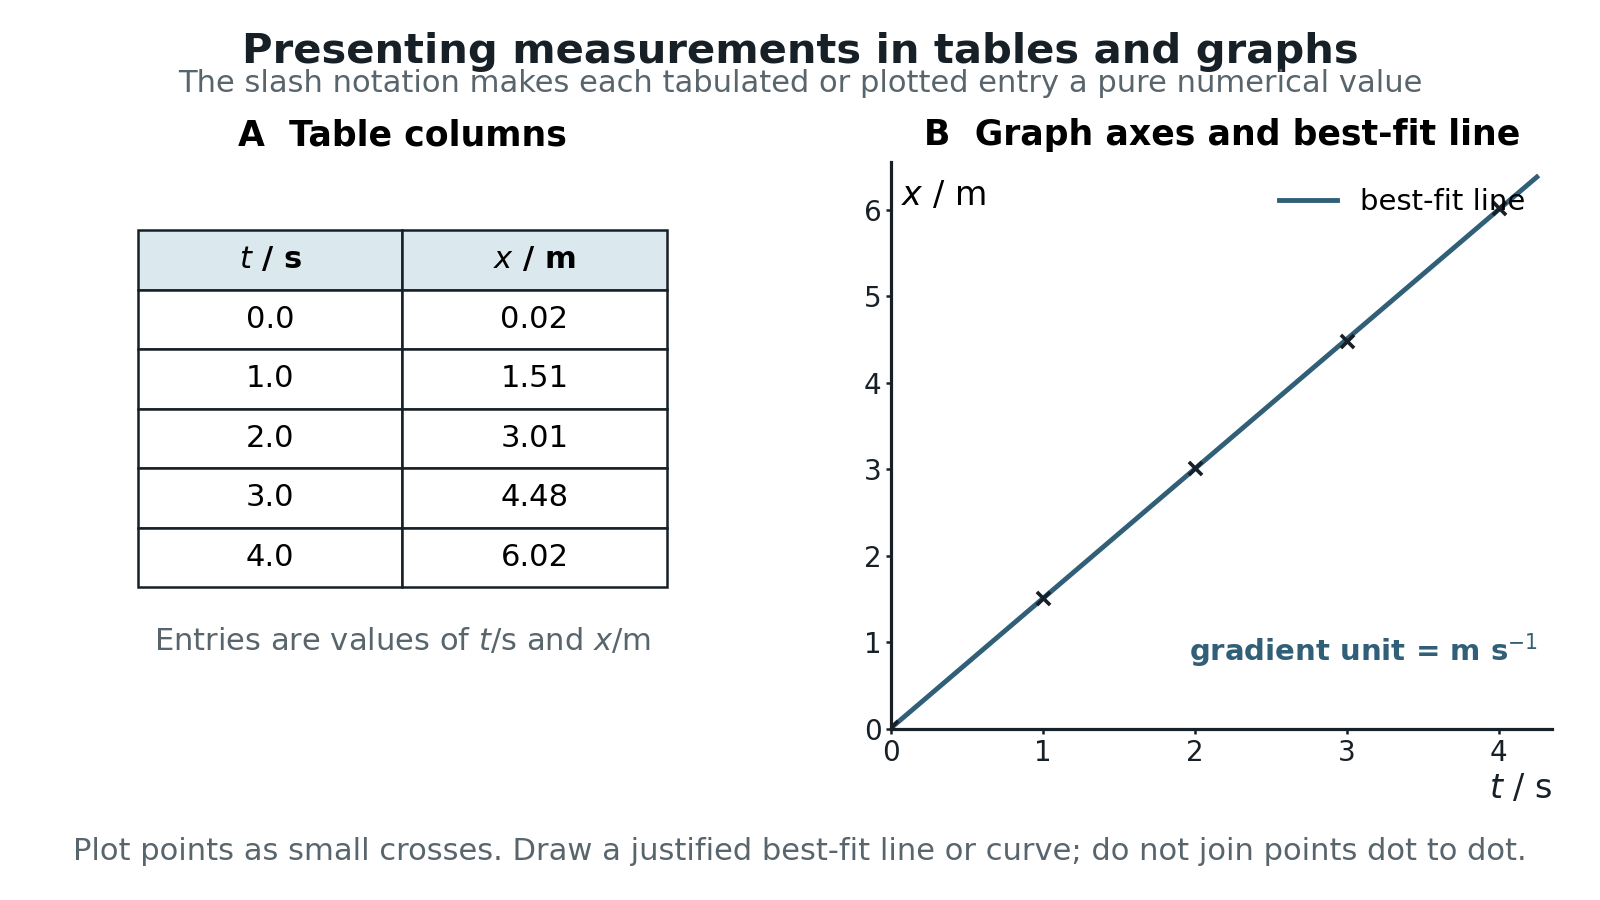
Figure: The table and graph labels use quantity / unit, so numerical entries and tick labels are dimensionless. Each plotted cross represents one coordinate pair from the table; the best-fit line summarises the overall trend rather than joining points dot-to-dot. The independent variable normally appears in the first table column and on the horizontal axis, and the gradient unit is the vertical-axis unit divided by the horizontal-axis unit.
A good graph should:
- use most of the available plotting area
- have easy-to-read scales
- show plotted points clearly
- use a best-fit line or smooth curve where appropriate
- not force the line through the origin unless justified
- place the independent variable on the horizontal axis unless there is a stated reason not to
- use simple scales that are easy to read and that occupy at least about half the available grid in each direction
- show each plotted point with a small, clear cross
Best-Fit Line
The line should represent the overall trend, not pass through every point.
For a straight-line graph, aim for a balanced distribution of points above and below the best-fit line. A smooth physical trend should be represented by a smooth curve, not by dot-to-dot segments.
8. Gradient and Intercept
These often have physical meaning.
Gradient
Units of gradient:
Use two well-separated points on the best-fit line, not necessarily two original data points, and draw a large gradient triangle. A larger triangle reduces the percentage effect of reading uncertainty.
Intercept
The intercept may represent:
- initial value
- zero error
- background effect
depending on the equation.
Example
On a velocity-time graph:
- gradient = acceleration
On a displacement-time graph:
- gradient = velocity
9. Enrichment: Logarithmic Quantities
This convention is useful in later linearisation work, although logarithmic plotting is not itself a standalone Measurement outcome.
Logarithms require dimensionless arguments.
So:
is not valid if carries a unit.
Instead use a ratio such as:
where and have the same unit.
Exam Relevance
In exams, data presentation marks are commonly lost through missing units, poor graph scales, unjustified significant figures, or weak gradient interpretation.
10. Common Graph and Table Mistakes
- missing units
- repeating units in every cell
- inconsistent decimal places
- poor scale choice
- plotting large unused blank regions
- joining dot-to-dot instead of best-fit
- not stating what gradient means
- quoting too many significant figures
11. Worked Mini Examples
Example 1: Table Heading
Correct:
t / sDo not use:
t(s)The ASE convention required here is quantity / unit.
Example 2: Gradient Units
If graph is:
- vertical axis:
- horizontal axis:
Then gradient unit:
Example 3: Significant Figures
If your measured values are to 2 significant figures, then:
should not be quoted as the final result without justified precision.
12. Fast Revision Summary
- Put units in headings and axis labels.
- Keep decimal places consistent in tables.
- Use significant figures sensibly.
- Use scales that make the graph easy to read.
- Draw a best-fit line when appropriate.
- Interpret gradient and intercept physically.