Measurement
Topic hub: This is the main overview page for Topic 01. Use it as the starting point, then follow the branch notes for deeper treatment of specific subtopics.
Overview
Measurement is the foundation of experimental physics. Every physical law is tested through observations and measured data. Good measurement requires:
- correct units
- sensible precision
- awareness of uncertainty
- clear presentation of data
- fair experimental design
This topic supports all later chapters such as Kinematics, Forces, and Current Electricity Fundamentals.
A strong understanding of measurement helps students avoid common practical and examination mistakes.
Current 9749 scope
Topic 01 includes not only units, uncertainty and data presentation, but also scalars and vectors, addition and subtraction of coplanar vectors, and resolution into perpendicular components. Use Scalars, Vectors and Components for these core outcomes.
Core Ideas
- A measurement combines a numerical value, a unit and an appropriate statement of uncertainty.
- SI base units provide a common language and allow homogeneity checks.
- Random variation affects spread; systematic effects bias the result or relationship.
- Scalars have magnitude only; vectors require magnitude and direction and must be combined vectorially.
Physical Quantities
A physical quantity is a measurable property that can be expressed by:
- a numerical value
- a unit
Examples:
- length =
- time =
- mass =
Physical quantities are divided into:
- base quantities
- derived quantities
SI Base Quantities and Units
The six base quantities and units that the 9749 syllabus requires you to recall are:
| Base quantity | SI base unit | Symbol |
|---|---|---|
| mass | kilogram | kg |
| length | metre | m |
| time | second | s |
| electric current | ampere | A |
| temperature | kelvin | K |
| amount of substance | mole | mol |
Wider SI enrichment
The complete SI system also has luminous intensity, measured in candela (cd). It is not part of the six-item 9749 recall list.
Derived Quantities and Units
Derived quantities are formed from base quantities.
Examples:
| Quantity | Expression | Unit |
|---|---|---|
| velocity | displacement / time | m s |
| acceleration | velocity / time | m s |
| force | mass × acceleration | N |
| energy | force × distance | J |
| pressure | force / area | Pa |
| charge | current × time | C |
Named units:
See Measurement Units and Dimensions.
SI Base Units and Homogeneity
For syllabus questions, rewrite every term in SI base units and check that corresponding terms have the same unit. For example, in
both and have unit . The equation is therefore homogeneous.
Enrichment: dimensional symbols
Dimensions describe the physical nature of quantities using symbols such as:
- Mass:
- Length:
- Time:
- Current:
Examples:
- velocity:
- acceleration:
- force:
Principle of Homogeneity
All terms in a valid physical equation must have the same dimensions.
Example:
- has dimension
- has dimension
Hence the equation is dimensionally consistent.
Dimensional checks help detect mistakes, but do not prove an equation is physically correct.
Prefixes and Orders of Magnitude
Common SI Prefixes
| Prefix | Symbol | Value |
|---|---|---|
| pico | p | |
| nano | n | |
| micro | ||
| milli | m | |
| centi | c | |
| deci | d | |
| kilo | k | |
| mega | M | |
| giga | G | |
| tera | T |
Examples:
Order of Magnitude
Approximate power of ten estimate.
Examples:
- diameter of atom
- human height
- Earth radius
See Measurement Estimation and Experimental Design.
Precision vs Accuracy
Precision
How close repeated readings are to one another.
- small spread of values
- related to random error
Accuracy
How close a result, or the mean of repeated results, is to the accepted/reference value.
- related to systematic error
Example
Readings of
- high precision
If the accepted/reference value is :
- also high accuracy
A set of readings can be:
- precise but inaccurate
- accurate on average but imprecise
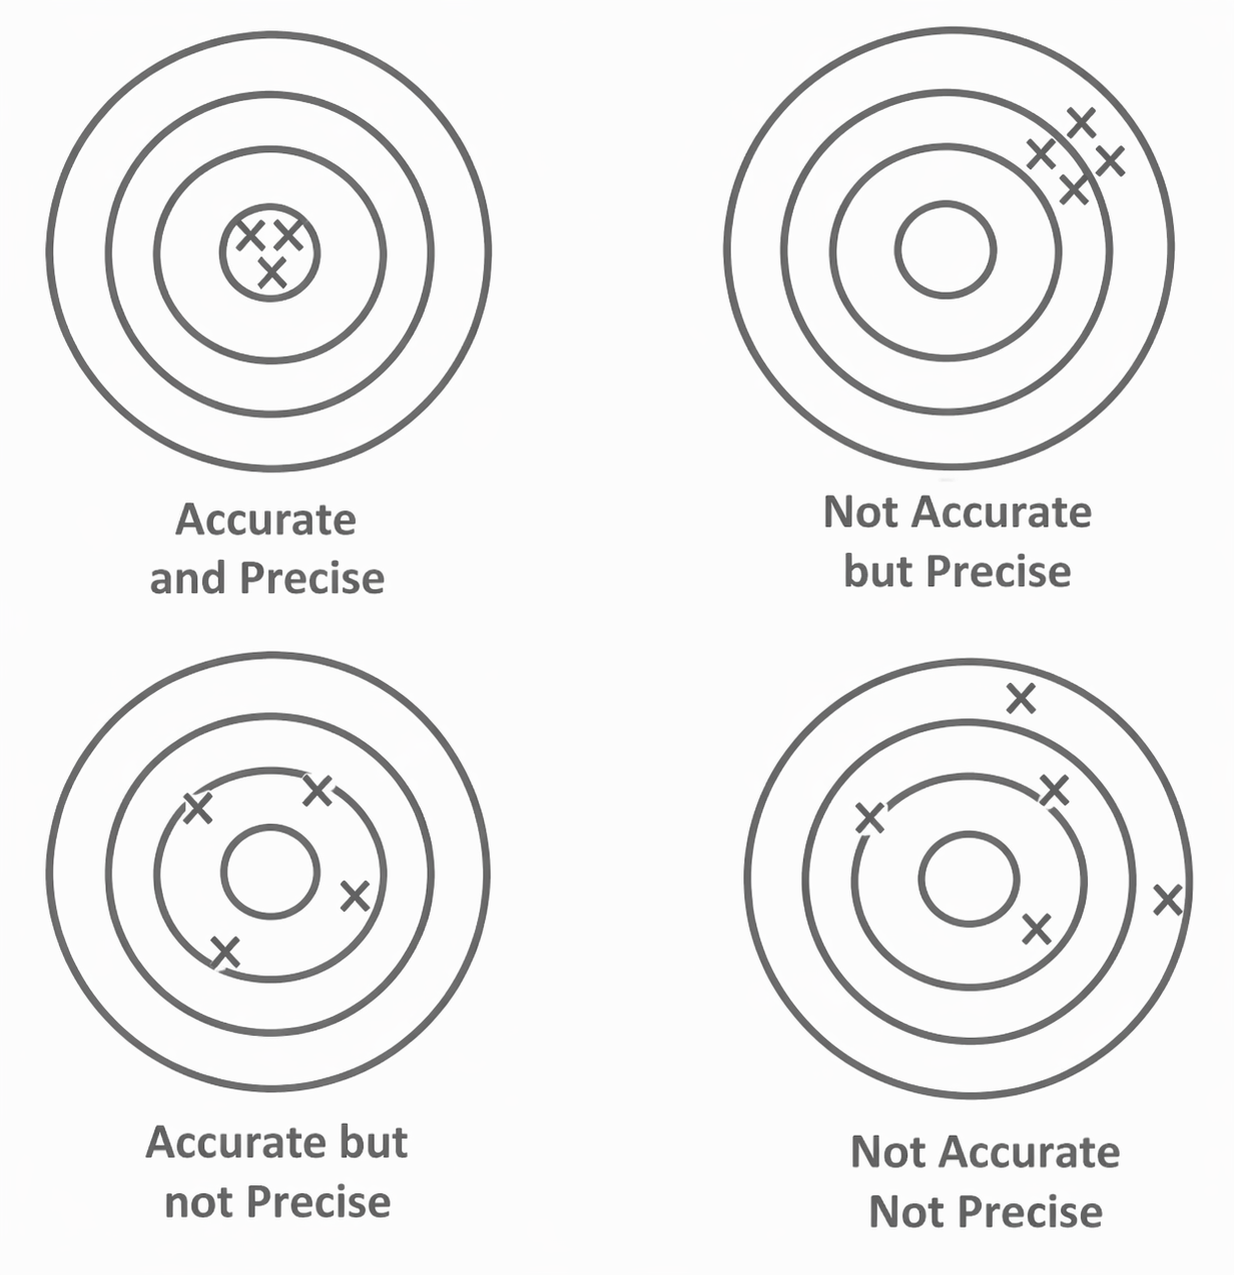
Figure: The spread of repeated points indicates precision. Displacement of the sample mean from the accepted/reference centre indicates inaccuracy for that sample; a persistent displacement larger than expected random uncertainty suggests systematic bias. A scattered set may have a mean near the reference while its individual readings remain imprecise.
Systematic Errors vs Random Errors
Systematic Errors
Repeatable biases or patterns under the same measurement conditions. They may be constant offsets, scale-factor errors or method-dependent effects.
Examples:
- zero error
- poor calibration
- heat loss in calorimetry
- friction ignored
Effects:
- reduces accuracy
- repeating readings does not remove it
Random Errors
Unpredictable fluctuations between readings.
Examples:
- reaction time
- changing surroundings
- variable judgement when reading a scale by eye; in contrast, consistently viewing a scale from the same wrong angle can produce systematic parallax bias
Effects:
- reduces precision
- repeated independent readings and averaging reduce the random contribution to the uncertainty of the estimated mean
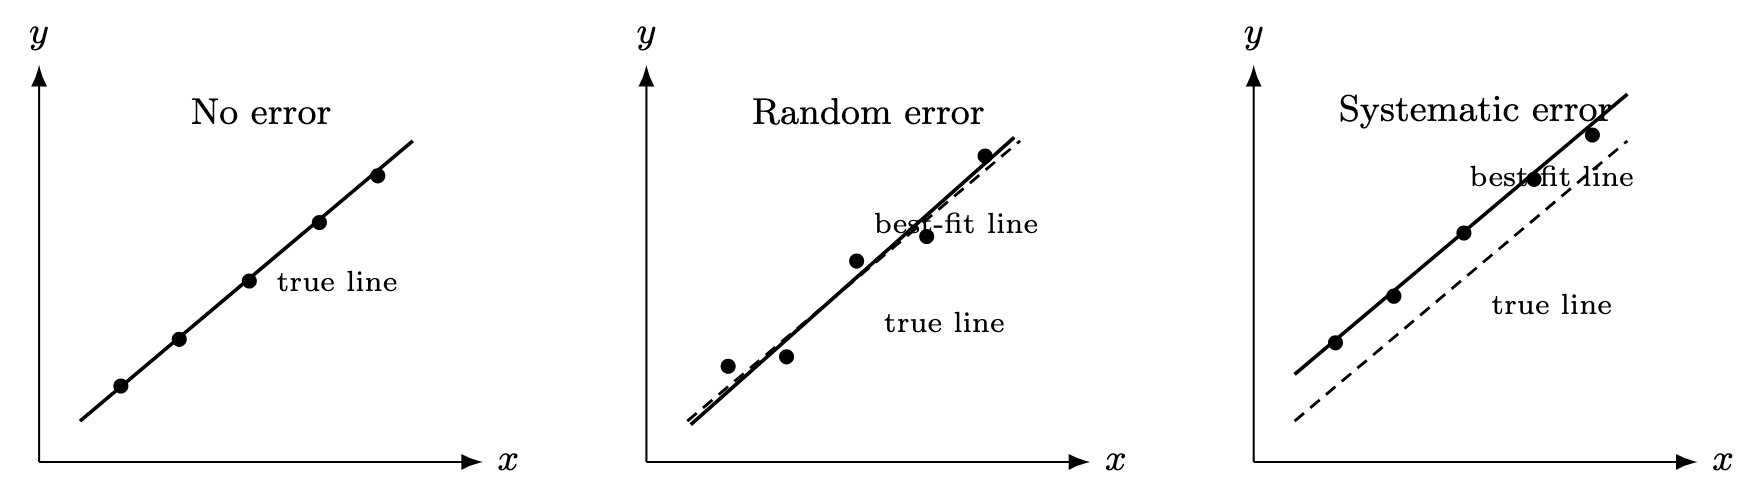
Figure: Random variation causes scatter. A systematic error produces a repeatable bias or pattern, such as an offset or scale error, and is not removed by averaging.
See Measurement Uncertainty and Errors.
Uncertainty Overview
Every measured value has uncertainty.
Example:
Under the stated uncertainty convention, the associated interval is:
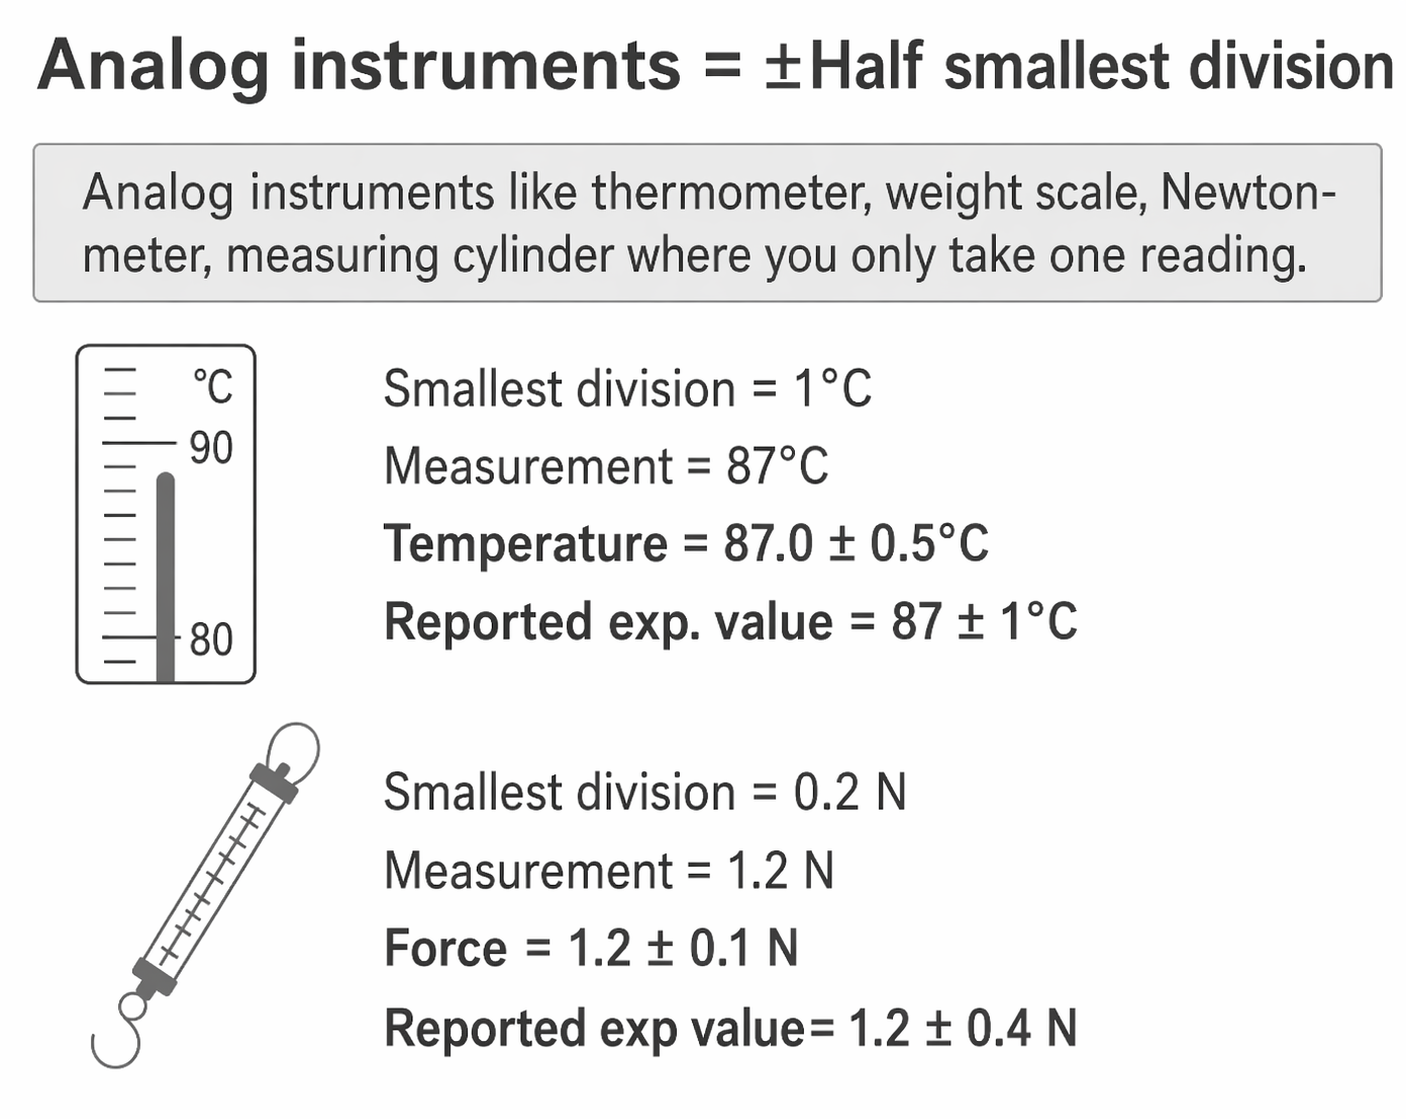
Figure: For one reading on a suitable analogue scale, half the smallest division is a common uncertainty estimate. If a result is obtained from two endpoint readings, both readings contribute uncertainty.
Fractional Uncertainty
Percentage Uncertainty
Example:
Percentage uncertainty:
Propagation
When values are combined, uncertainties combine too.
See Uncertainty Propagation Methods.
Data and Graph Overview
Experimental data must be presented clearly.
Tables
Use headings with quantity and unit.
Example:
| 0.0 | 0.00 |
| 1.0 | 2.10 |
| 2.0 | 4.20 |
Graphs
Include:
- title if needed
- labelled axes
- units
- sensible scales
- best-fit line/curve
Useful Interpretation
- gradient often represents physical quantity
- intercept may have meaning
Example:
Velocity-time graph gradient = acceleration.
See Measurement Data Presentation.
Estimation and Experimental Design Overview
Physics students should be able to estimate sensible values and plan fair tests.
Good Experiment Design Includes:
- suitable instrument choice
- control of variables
- repeated measurements
- reduction of uncertainty
- clear method
- safe procedure
Example
To measure pendulum period:
- time 20 oscillations instead of 1
- divide by 20
This reduces the fractional contribution of the approximately fixed start/stop timing uncertainty to the calculated period; it does not make the observer’s absolute reaction time smaller.
See Measurement Estimation and Experimental Design.
Scalars and Vectors: Syllabus Core
A scalar is completely specified by magnitude; a vector requires both magnitude and direction. Vector quantities cannot in general be combined by ordinary scalar arithmetic.
For the examinable methods—head-to-tail addition, subtraction by adding the negative vector, and resolution into perpendicular components—study:
Scalars, Vectors and Components
The broader Vectors foundation is useful enrichment for later topics.
For example, north followed by east gives a resultant displacement of at east of north—not —because the directions must be included.
Formula Summary
Density
Speed
Fractional Uncertainty
Percentage Uncertainty
Gradient
Common Exam Mistakes
- omitting units
- wrong unit prefixes
- confusing precision with accuracy
- confusing systematic and random errors
- too many significant figures
- graph axes not labelled
- using poor scale
- drawing line through every point instead of best-fit line
- forgetting uncertainty in final answer
Fast Revision Checklist
You should be able to:
- state SI base quantities and units
- convert prefixes
- determine derived units
- check homogeneity
- explain precision vs accuracy
- distinguish systematic vs random errors
- calculate percentage uncertainty
- present tables and graphs properly
- describe methods to reduce uncertainty
- distinguish scalar and vector quantities and give examples
- add and subtract coplanar vectors
- resolve a vector into two perpendicular components
Branch Notes
- Measurement Units and Dimensions
- Measurement Uncertainty and Errors
- Uncertainty Propagation Methods
- Measurement Data Presentation
- Measurement Estimation and Experimental Design
- Scalars, Vectors and Components
Exam Relevance
Measurement concepts are fundamental across H2 Physics. Students are frequently tested on dimensional consistency, experimental uncertainty, systematic and random errors, graph interpretation, significant figures, and vector operations. These skills also support later topics such as vectors, kinematics, and dynamics.
Common exam traps include:
- using the gram instead of kilogram as the SI base unit of mass;
- treating a dimensionally valid equation as automatically correct;
- confusing systematic error with random error;
- claiming too many significant figures from a calculator;
- adding percentage uncertainties for addition or subtraction;
- adding absolute uncertainties for multiplication or division;
- ignoring direction when working with vector quantities.
Links
- Foundation: Vectors
- Related: Kinematics
- Related: Forces
- Related: Dynamics
- Related: Thermal Physics A
- Related: Current Electricity Fundamentals
Provenance
- anchor note: Measurement Lecture Anchor Notes Main
- Topic 1 branch notes were relocated into the Measurement topic folder on 2026-06-25, with legacy compatibility redirects retained under
content/concepts/.