Measurement Uncertainty and Errors
Branch note: This page deepens one part of Measurement.
Overview
No physical measurement is perfectly exact. Every reading is limited by:
- instrument resolution
- observer judgement
- experimental method
- environmental effects
Therefore, measured values should be reported with uncertainty and interpreted with an understanding of error sources.
This page expands the uncertainty section of Measurement.
Core Ideas
- Uncertainty describes the likely spread in a measured value.
- Systematic errors affect accuracy; random errors affect precision.
- Repeated independent readings and averaging reduce the random uncertainty in the estimated mean; they do not remove the underlying fluctuations or systematic bias.
Why It Matters
Uncertainty and error analysis tell you how reliable a measurement is and whether an experimental result deserves confidence.
Definition
Measurement uncertainty is a stated estimate of the doubt in a measured value. Writing identifies an interval associated with the measurement; at this level it is not a rigorous probability statement or a guarantee that the true value lies inside it.
Key Representations
Error vs Uncertainty
Error
In principle, signed error is the difference between a measured value and the true value. Because the true value is generally unknown, experiments often compare with an accepted or reference value; the measured-minus-reference difference is then more precisely described as a deviation from the reference.
Example:
Take the accepted/reference value of as .
Measured value:
Deviation from the reference:
Uncertainty
Uncertainty states the estimated interval associated with the measured result.
Example:
Associated interval:
Uncertainty is usually more useful than quoting error, since the true value is often unknown.
Absolute Uncertainty
Absolute uncertainty is written in the same unit as the measurement.
Examples:
Instrument-Based Estimate
For analogue instruments:
- for one directly read value, uncertainty is often estimated as half the smallest scale division when interpolation is reasonable
Example:
Metre rule marked every
Estimated uncertainty:
For digital meters:
- uncertainty often taken as least significant digit unless stated otherwise
Always use a stated manufacturer or question uncertainty in preference to these default estimates. If a measured length is the difference of two scale readings, both endpoint readings contribute; do not automatically assign only one half-division to the final difference.
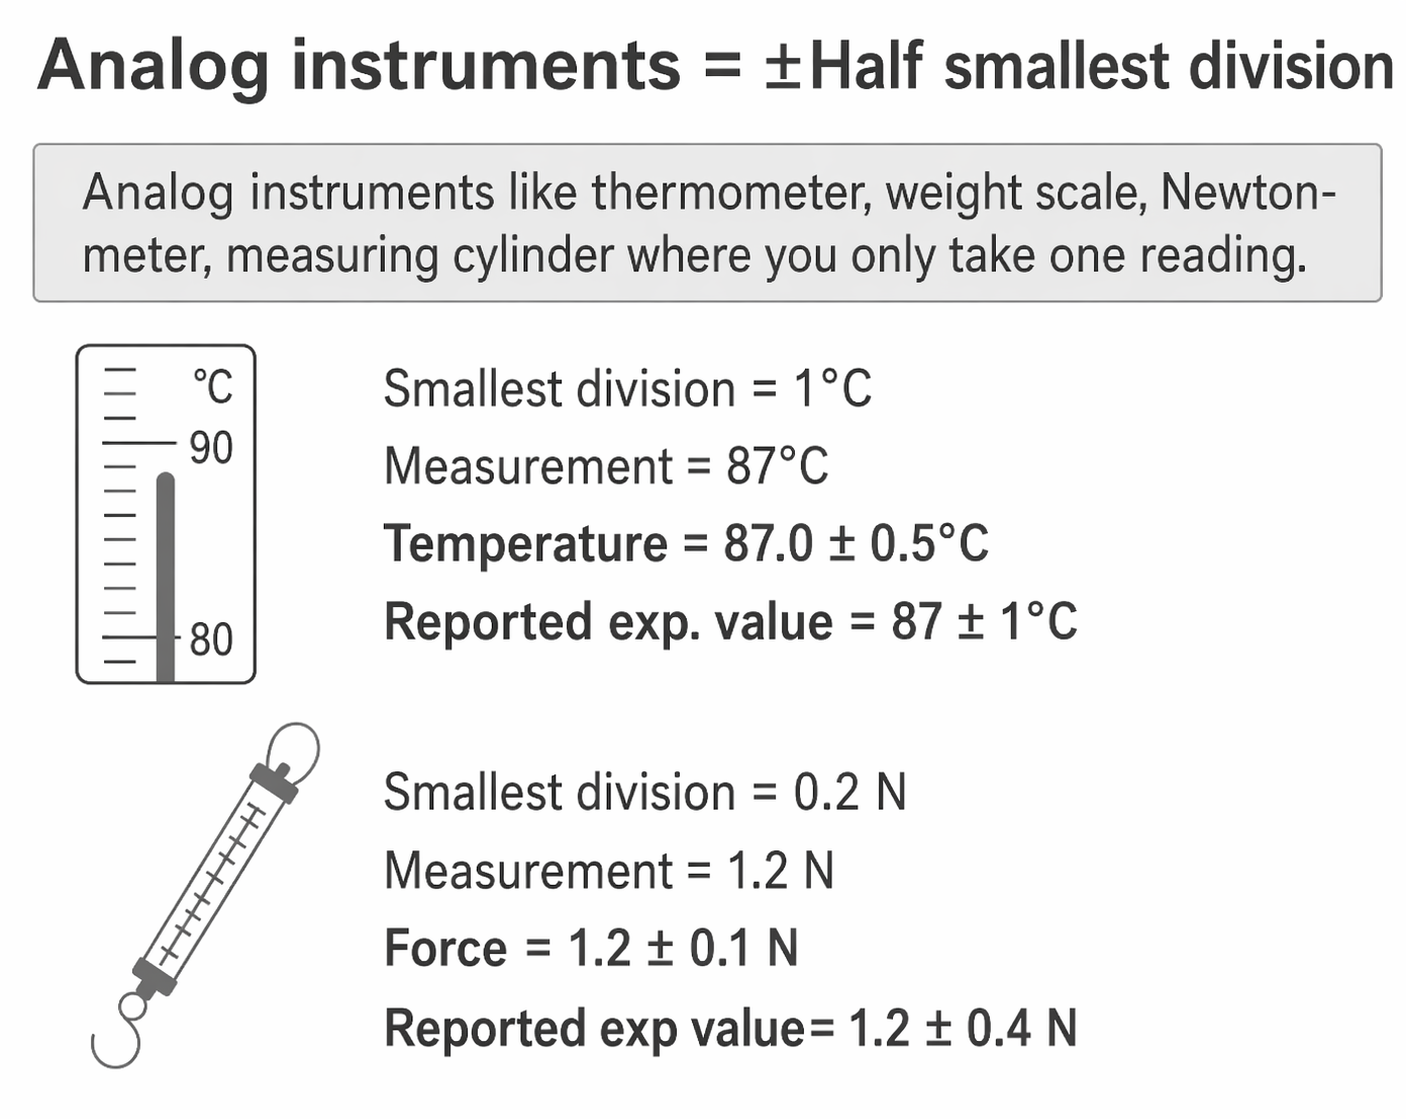
Figure: Conditional analogue-reading rule. For one reading on a suitable analogue scale, half the smallest division is a common estimate. A value obtained from two endpoint readings receives uncertainty contributions from both readings.
Fractional Uncertainty
Example:
Then:
Percentage Uncertainty
Using the previous example:
Why Percentage Uncertainty Matters
It allows comparison of quality of different measurements.
Compare:
- →
- →
Although both have absolute uncertainty, the first is much better relatively.
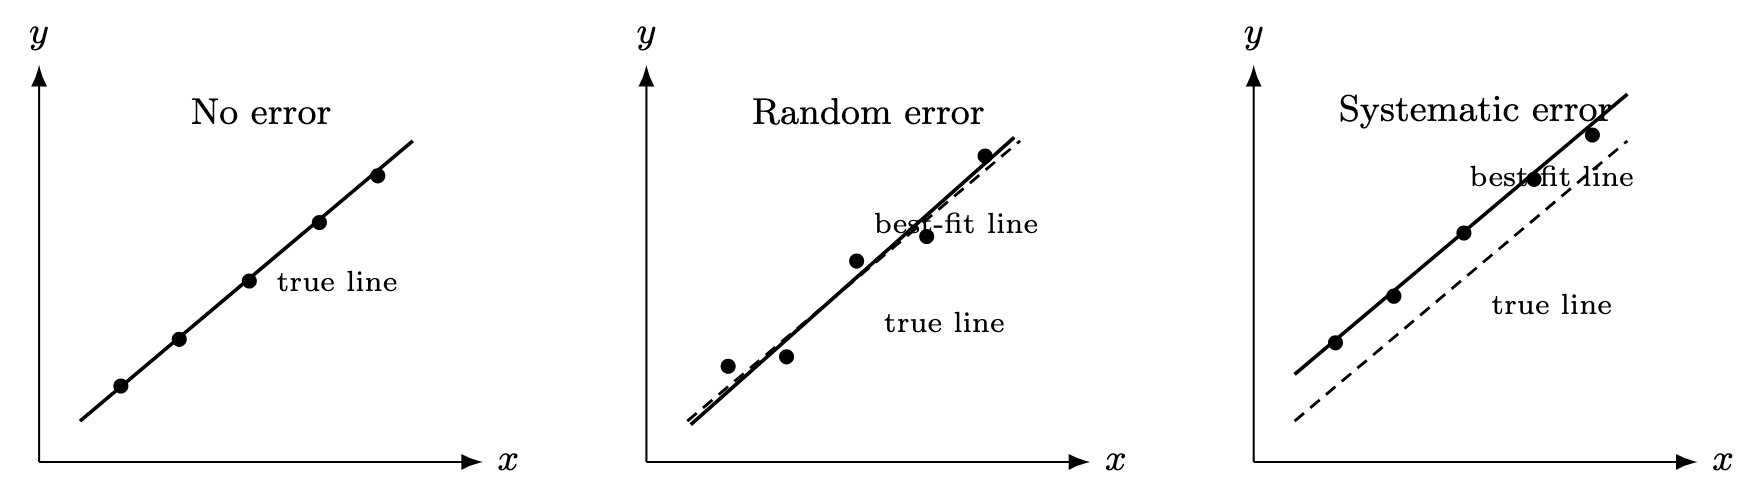
Figure: Random variation produces scatter around a trend. A systematic effect produces a repeatable bias or pattern, so the mean or best-fit relationship can remain displaced from the accepted relationship even after averaging.
Systematic Errors
Systematic errors produce a repeatable bias or pattern under the same conditions. The effect may be a constant offset, a scale-factor error, or another consistent dependence; it need not be the same numerical amount for every reading.
They reduce accuracy.
Examples
- zero error on vernier calipers
- stopwatch consistently slow
- poor calibration
- heat loss in calorimeter
- friction ignored in theory
Features
- repeated readings may agree closely
- averaging does not remove it
- reduced or corrected only when the cause is identified—for example by zero correction, calibration, background subtraction, or a redesigned method
Random Errors
Random errors cause scatter in repeated readings.
They reduce precision.
Examples
- reaction time variation
- fluctuating surroundings
- slight reading judgement differences
- unstable power supply
Features
- readings fluctuate and, with adequate sampling and no systematic bias, scatter about an underlying mean or trend; a small sample need not look symmetric
- repeated independent measurements reduce the random contribution to the uncertainty of the estimated mean
- averaging does not remove the underlying fluctuations and cannot correct a systematic bias
Precision vs Accuracy
Precision
How close repeated readings are to one another.
High precision means:
- small spread
- low random uncertainty
Accuracy
How close a result, often the mean of repeated readings, is to the accepted/reference value available for comparison.
High accuracy means:
- low systematic error
Typical Cases
High Precision, Low Accuracy
Readings:
Very close together, but if true value is , then inaccurate.
Low Precision, Good Average Accuracy
Readings:
Spread is larger, but average may be close to true value.
Repeated Measurements
Repeated readings improve reliability.
Mean Value
Range Estimate
For repeated readings, a practical estimate of uncertainty is sometimes obtained from the spread:
This half-range is a simple H2 estimate, not a rigorous statistical confidence interval. It is most informative when the repeats sample the random variation reasonably.
Example: Pendulum Timing
Instead of timing one oscillation:
- reaction time large relative to measurement
Better method:
- time 20 oscillations
- divide by 20
This reduces percentage uncertainty.
Recording Measurements Correctly
Write measured value and uncertainty consistently.
Correct
Incorrect
(decimal places inconsistent)
Rule for Decimal Places
The measured value should be rounded to the same decimal place as the uncertainty.
Examples:
Correct
Correct
Incorrect
Practical Examples
Example 1: Measuring Wire Diameter
Using metre rule:
range is suitable, but resolution is too coarse for a thin wire
Using micrometer screw gauge:
finer resolution and smaller read-off uncertainty for this diameter
Choose the instrument whose range, resolution and contact geometry suit the measurement.
Example 2: Measuring Time of Motion
Short motion lasting timed manually gives high percentage uncertainty.
Better:
- use light gate
- increase timing interval if possible
Example 3: Cooling Experiment
If thermometer reads consistently high:
- systematic error
If readings fluctuate by :
- random error
How to Reduce Uncertainty
Reduce Systematic Error
- calibrate instrument
- correct zero error
- improve insulation
- reduce friction
- better alignment
Reduce Random Error
- repeat measurements
- average readings
- use larger measured interval
- choose an instrument with suitable range and finer resolution where instrument resolution contributes significantly to measurement uncertainty
- reduce vibrations / drafts
Exam Relevance
In exams, uncertainty and error analysis are often tested through reading instruments, quoting values with uncertainty, distinguishing error types, and suggesting practical improvements.
Common Exam Mistakes
- saying repeated readings remove systematic error
- confusing precision with accuracy
- quoting too many decimal places
- omitting units in uncertainty
- giving percentage uncertainty without calculation
- using unsuitable instrument
Fast Revision Summary
- All measurements have uncertainty.
- Systematic errors affect accuracy.
- Random errors affect precision.
- Repeated independent readings and averaging reduce the random uncertainty in the estimated mean; they do not remove the underlying fluctuations.
- Quote results as:
- Compare quality using percentage uncertainty.