p-V Diagrams and Cycles
Enrichment — beyond the explicit 2026 syllabus
Detailed p–V work, named thermodynamic paths, cycles and engine interpretations are not explicit outcomes in the 9749 syllabus. They are retained because they deepen first-law reasoning. Do not let them displace the core requirements in First Law and Thermodynamic Processes.
Overview
A pressure-volume (p–V) diagram is one of the most important tools in thermodynamics. It shows how the pressure and volume of a gas change during a process.
From a p–V graph, you can determine:
- the thermodynamic path taken
- whether gas expands or is compressed
- work done by or on the gas
- whether the process is cyclic
- net work output of an engine
This page develops p–V diagrams as an enrichment application of first-law ideas. It is not presented as an explicit 2026 examination outcome.
Related hub:
Definition
A p–V diagram is a graph with pressure on the vertical axis and volume on the horizontal axis. For a fixed amount of simple gas in equilibrium, each point represents a state. A continuous gas-pressure path represents a quasistatic process; for a non-quasistatic process, boundary work is determined from the external pressure rather than an imagined equilibrium gas path.
Why It Matters
p–V graphs allow students to determine work from area, identify process type, compare different paths between same states, analyse engine cycles, and apply the first law efficiently.
Key Representations
Core Ideas
- Each point on a p-V diagram represents a thermodynamic state.
- A path represents a process, and different paths can connect the same states.
- Area under a p-V path gives pressure-volume work, with sign determined by direction.
- A closed cycle returns to the same state, so over one full cycle.
- The area enclosed by a cycle gives the magnitude of net work over the cycle; the sign depends on whether work is defined as done by or on the gas.
Exam Relevance
Use this enrichment branch, after mastering the syllabus core, to read p–V diagrams, compare quasistatic paths and analyse idealised cycles.
1. Basic Structure of a p–V Diagram
- Vertical axis: pressure
- Horizontal axis: volume
For a fixed amount of ideal gas, each equilibrium point fixes through . The coordinates are not, by themselves, a complete universal description of every thermodynamic system.
That state may be described by:
- pressure
- volume
- temperature
- amount of gas
For an ideal gas:
So once and are known (for fixed ), temperature is determined.
2. Meaning of a Path
A path joining two points shows how the gas changed from one state to another.
Example:
- State A → State B by one path
- State A → State B by another path
Both give the same final state, but:
- work done may differ
- heat transferred may differ
However:
- change in internal energy depends only on initial and final states
3. Work from Area Under Graph
Core Result
In general, boundary work done by a gas is determined by the external pressure:
so . For a quasistatic path, at the moving boundary and the plotted gas pressure may be used.
Therefore:
- magnitude of work = area under curve
- sign depends on direction of motion
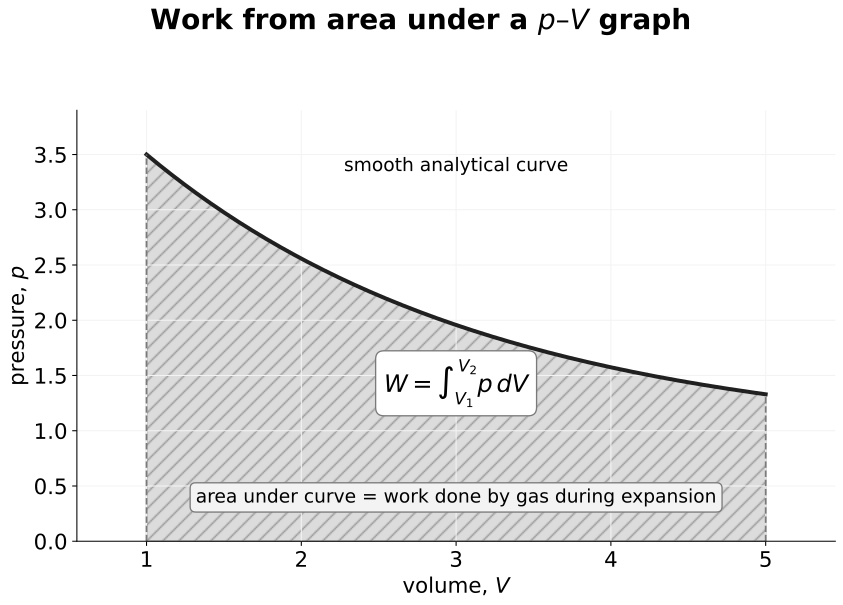
Figure: For the quasistatic expansion shown, the shaded area is and . For a non-quasistatic boundary motion, use rather than an imagined equilibrium gas path.
Always read the direction of motion along the curve before deciding the sign of the work.
4. Expansion vs Compression
Expansion
Gas volume increases (move right).
Hence:
Gas does work on surroundings.
Compression
Gas volume decreases (move left).
Hence:
Surroundings do work on gas.
5. Common Graph Shapes
5.1 Isochoric Process (Constant Volume)
Vertical line.
So:
No area under vertical path.
Interpretation
Pressure changes because temperature changes.
5.2 Isobaric Process (Constant Pressure)
Horizontal line.
Work:
Area is a rectangle.
5.3 Isothermal Process
For ideal gas:
Curve is a rectangular hyperbola.
Since:
Heat transfer balances work.
5.4 Adiabatic Process
No heat transfer:
For comparable reversible ideal-gas paths through the same state, the adiabatic curve is steeper than the isothermal curve.
During expansion:
- gas cools
- pressure falls faster than in the isothermal case
6. Comparing Isothermal and Adiabatic Curves
For reversible ideal-gas expansions starting from the same state:
- adiabatic expansion curve drops more steeply
- isothermal curve falls less steeply
Reason:
- isothermal: temperature maintained
- adiabatic: temperature decreases during expansion
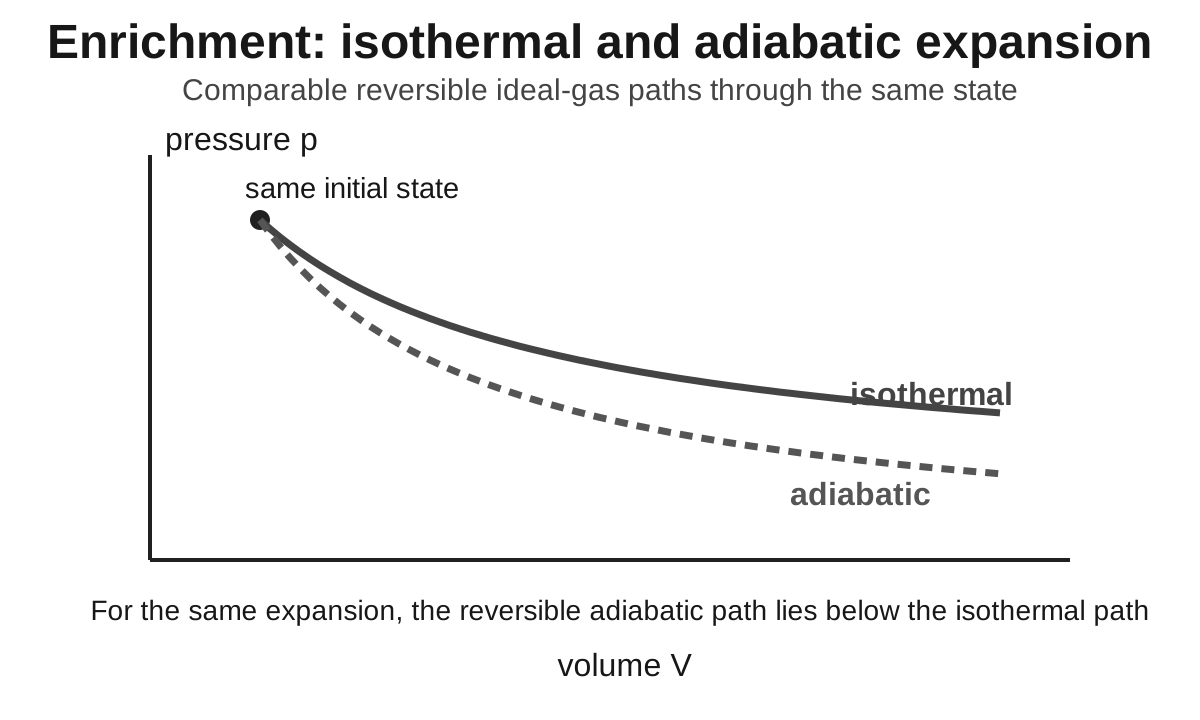
Figure: For comparable reversible ideal-gas expansions from the same initial state, the adiabatic path lies below and is steeper than the isothermal path because its temperature decreases during expansion.
This is a common comparison question: adiabatic expansion cools the gas, so pressure falls faster than in the isothermal case.
7. Cyclic Processes
A cyclic process returns gas to its original state.
Example:
A → B → C → A
Since initial state = final state:
Hence over one full cycle:
or equivalently:
net heat supplied = net work done by gas.
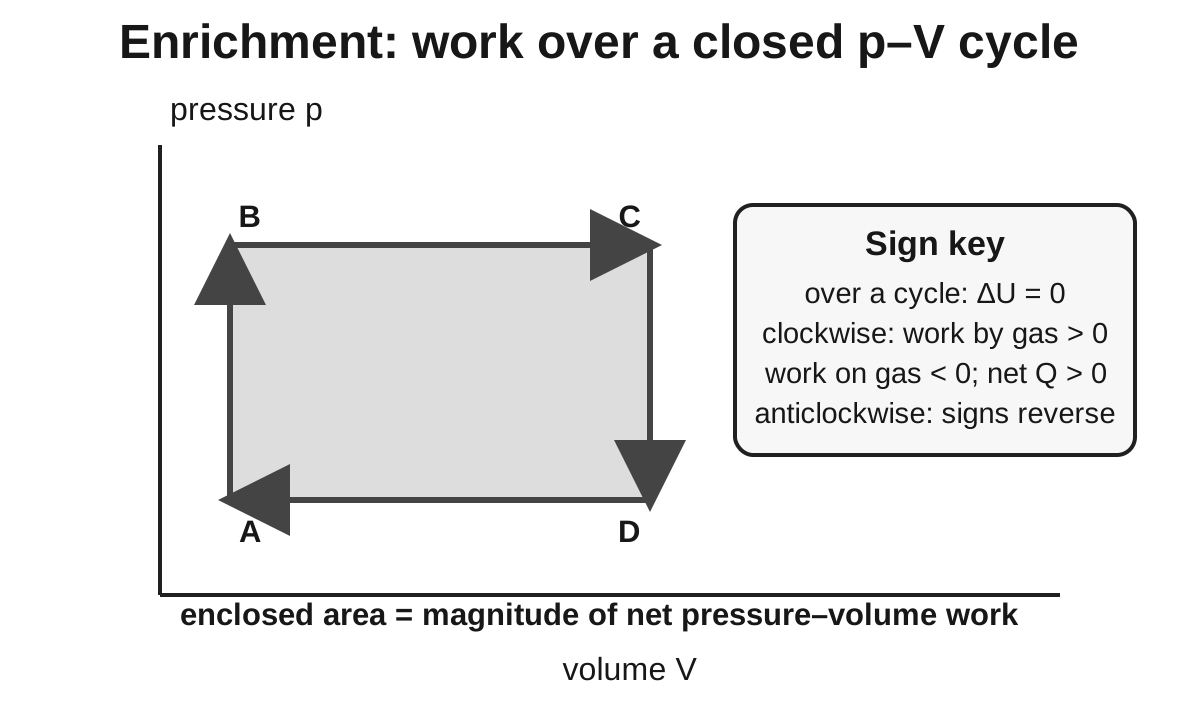
Figure: The visible arrows define the loop direction. For a clockwise quasistatic cycle, , and, because , . The enclosed area gives the magnitude of the net pressure–volume work.
For a full cycle, the state returns to its starting point, so even though the net work and net heat transfer may be non-zero.
8. Enclosed Area of a Cycle
The area enclosed by a closed loop on a p–V graph equals the magnitude of the net pressure-volume work in one cycle.
With the usual graph convention:
a clockwise cycle has positive net work by the gas. With this wiki’s first-law convention:
Clockwise Cycle
Usually:
- gas does net work on surroundings
- engine output
Anticlockwise Cycle
Usually:
- surroundings do net work on gas
- refrigerator or heat-pump style cycle
9. Engine Interpretation
A heat engine repeatedly cycles gas.
Typical idea:
- gas expands at high pressure
- gas is compressed at lower pressure
- for a clockwise engine cycle, enclosed area = magnitude of useful work output
For a heat-engine cycle, a larger enclosed area means greater work output per cycle.
10. First-Law Link for p-V Graphs
A p-V diagram gives work information directly, but it does not give heat transfer directly. To find heat, combine the graph with the first law.
Use the convention in this topic:
and:
For a graph question, the usual workflow is:
- Read the direction of the path to decide expansion or compression.
- Find the magnitude of work from the area under the path.
- Assign the sign of : expansion gives , compression gives .
- Decide from the state change, usually through temperature for an ideal gas.
- Use to find if needed.
For a complete cycle, the gas returns to its initial state, so:
Hence:
The signed enclosed area gives the net work by the gas; the first law then gives the net heat supplied.
11. Worked Examples
Example 1: Constant Pressure Expansion
A gas expands from:
to
at constant pressure:
Find work done on gas.
Solution
Gas does 450 J of work.
Example 2: Constant Volume Heating
Pressure rises vertically on graph.
Since:
Then:
No work done.
Example 3: Rectangular Cycle
Gas undergoes a rectangular cycle with:
- pressure difference
- volume difference
Net work magnitude:
Example 4: Same Initial and Final State, Different Paths
Gas goes from A to B by two different routes.
Since internal energy is state-dependent:
is the same for both paths.
But area under graph differs, so work differs.
Hence heat transfer must also differ.
12. Reading Questions Strategically
Step 1: Identify Direction
Rightward arrow:
- expansion
Leftward arrow:
- compression
Step 2: Identify Shape
- vertical → isochoric
- horizontal → isobaric
- hyperbola → isothermal
- a steeper falling curve can be identified as adiabatic only when comparing reversible ideal-gas paths through the same state
Step 3: Use Area
Find work from geometry where possible:
- rectangle
- triangle
- trapezium
Step 4: Apply First Law
13. State Property Reasoning
Internal energy of ideal gas depends on temperature only.
For monatomic ideal gas:
So if state returns to original point:
Even if large work and heat exchanges occurred during the cycle.
Summary
p–V diagrams are not just graphs of state. They encode path, work, and cycle behaviour. Strong answers come from reading direction, recognising process shape, and using area correctly.
This equals the signed area under the curve.
Using the dossier convention:
where is work done on the system.
Expansion gives , so . Compression gives , so .
Common shapes:
| Shape | Process |
|---|---|
| Vertical line | Isochoric |
| Horizontal line | Isobaric |
| Hyperbola | Isothermal |
| Steeper falling curve | Adiabatic |
| Closed loop | Cycle |
For a cyclic process:
so:
The enclosed signed area of a closed loop gives net work done by the gas. A clockwise cycle usually represents positive net work by the gas; an anticlockwise cycle usually represents work input.
Using:
and:
for a cycle:
so:
for net values.
Common Exam Traps
Signed area under a - graph gives work done by gas, not heat.
Same start and end points do not mean same work. Work depends on path.
Closed cycle means , not zero work.
Vertical line means constant volume, not constant pressure.
Horizontal line means constant pressure, often with non-zero work.
This wiki uses , so expansion gives negative for work done on the system.